.png)
Editorial + report system
DUSA reports, broken down.
Eight years of funder-facing output — annual reports, financial reports, pitch decks, sponsorship packages — off one editorial system. This page takes it apart: the palette, the type, and the KPI stat-row rebuilt live from real figures. The report PDFs fill in the page grid and chart language (manifest).
📖 Read it book-style — flip pages + toolkitIn my words
What I made
I was DUSA's lead designer for everything a funder or the public ever saw — annual reports, financial reports, pitch decks, sponsorship packages, brochures, the 50-state voter guide. The job was making a nonprofit look as credible and as funded as the work actually was.
My contribution was systematizing it: a shared grid, type scale, and a reusable stat-tile language so eight years of documents read as one organization, and each new report was an assembly job, not a redraw. The numbers below are the ones those reports led with.
- Role
- Graphic Designer
- Tenure
- 2019–2025
- Output
- Reports · decks · guides
- Reach
- 2.1M+ · 160k+
By the numbers
The report room, quantified
Six years as DUSA's lead designer — output you can flip through right here.
Reach is DUSA organizational, 2017–2025.
Color
Constants, and what varies
DUSA's institutional blue leads; a warm gold carries highlights and chart accents.
Constants
Type
Typefaces + specimens
Closest-match stand-ins; the production report typefaces are confirmed from the supplied PDFs.
The stat row
The KPI row, rebuilt live
The stat-tile row every report led with, re-rendered from the real DUSA figures — scroll it into view.
The same stat-tile row headlined the annual reports, pitch decks, and sponsorship packages — one component, refilled per document from real figures.
The chrome
Repeating components, named
The repeating furniture across every report and deck.
The asset set
The vocabulary the system draws on
The library
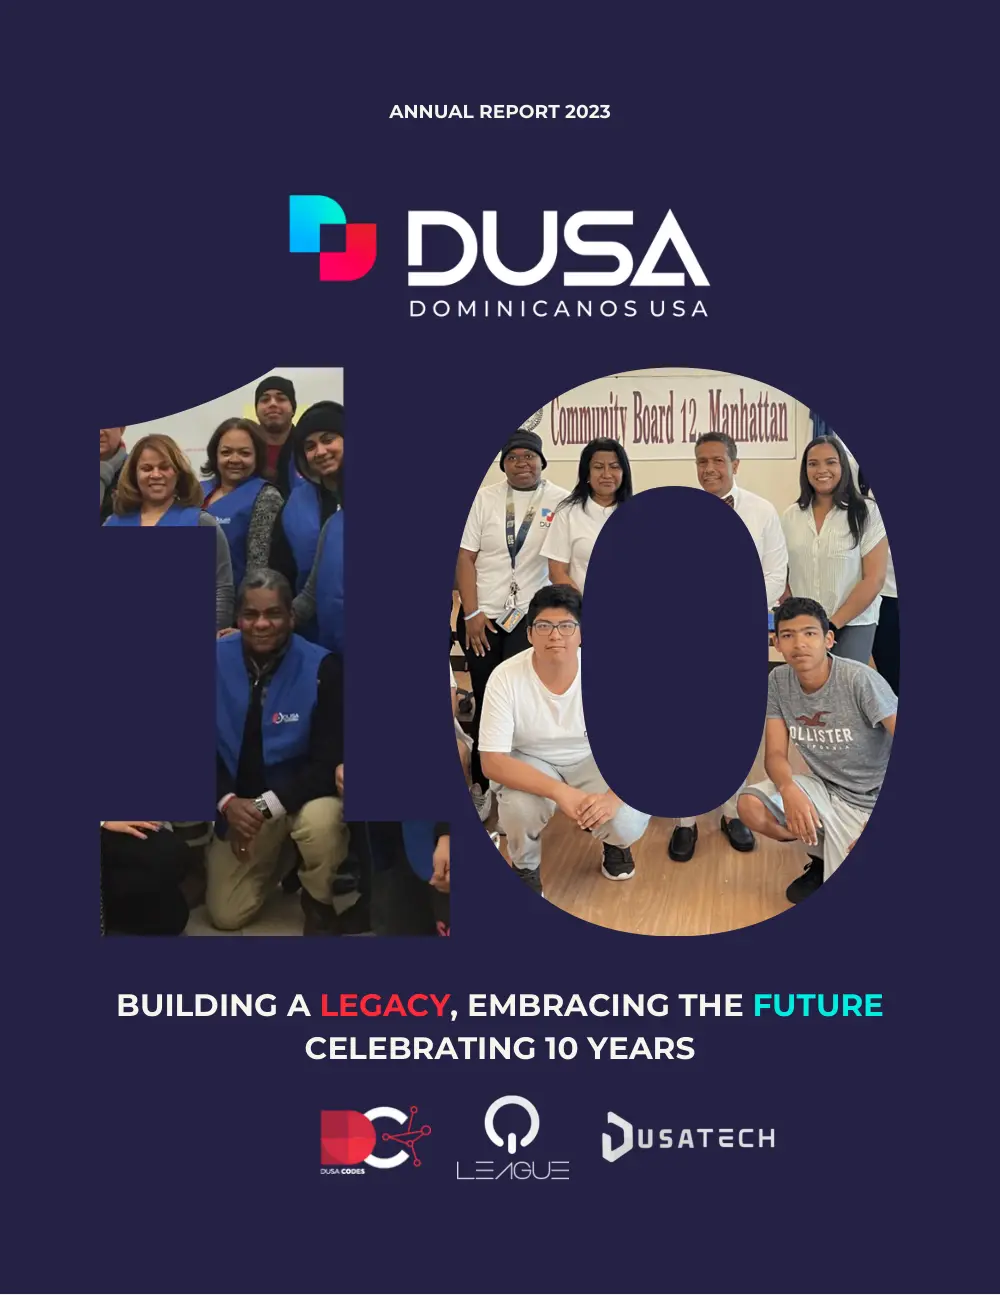
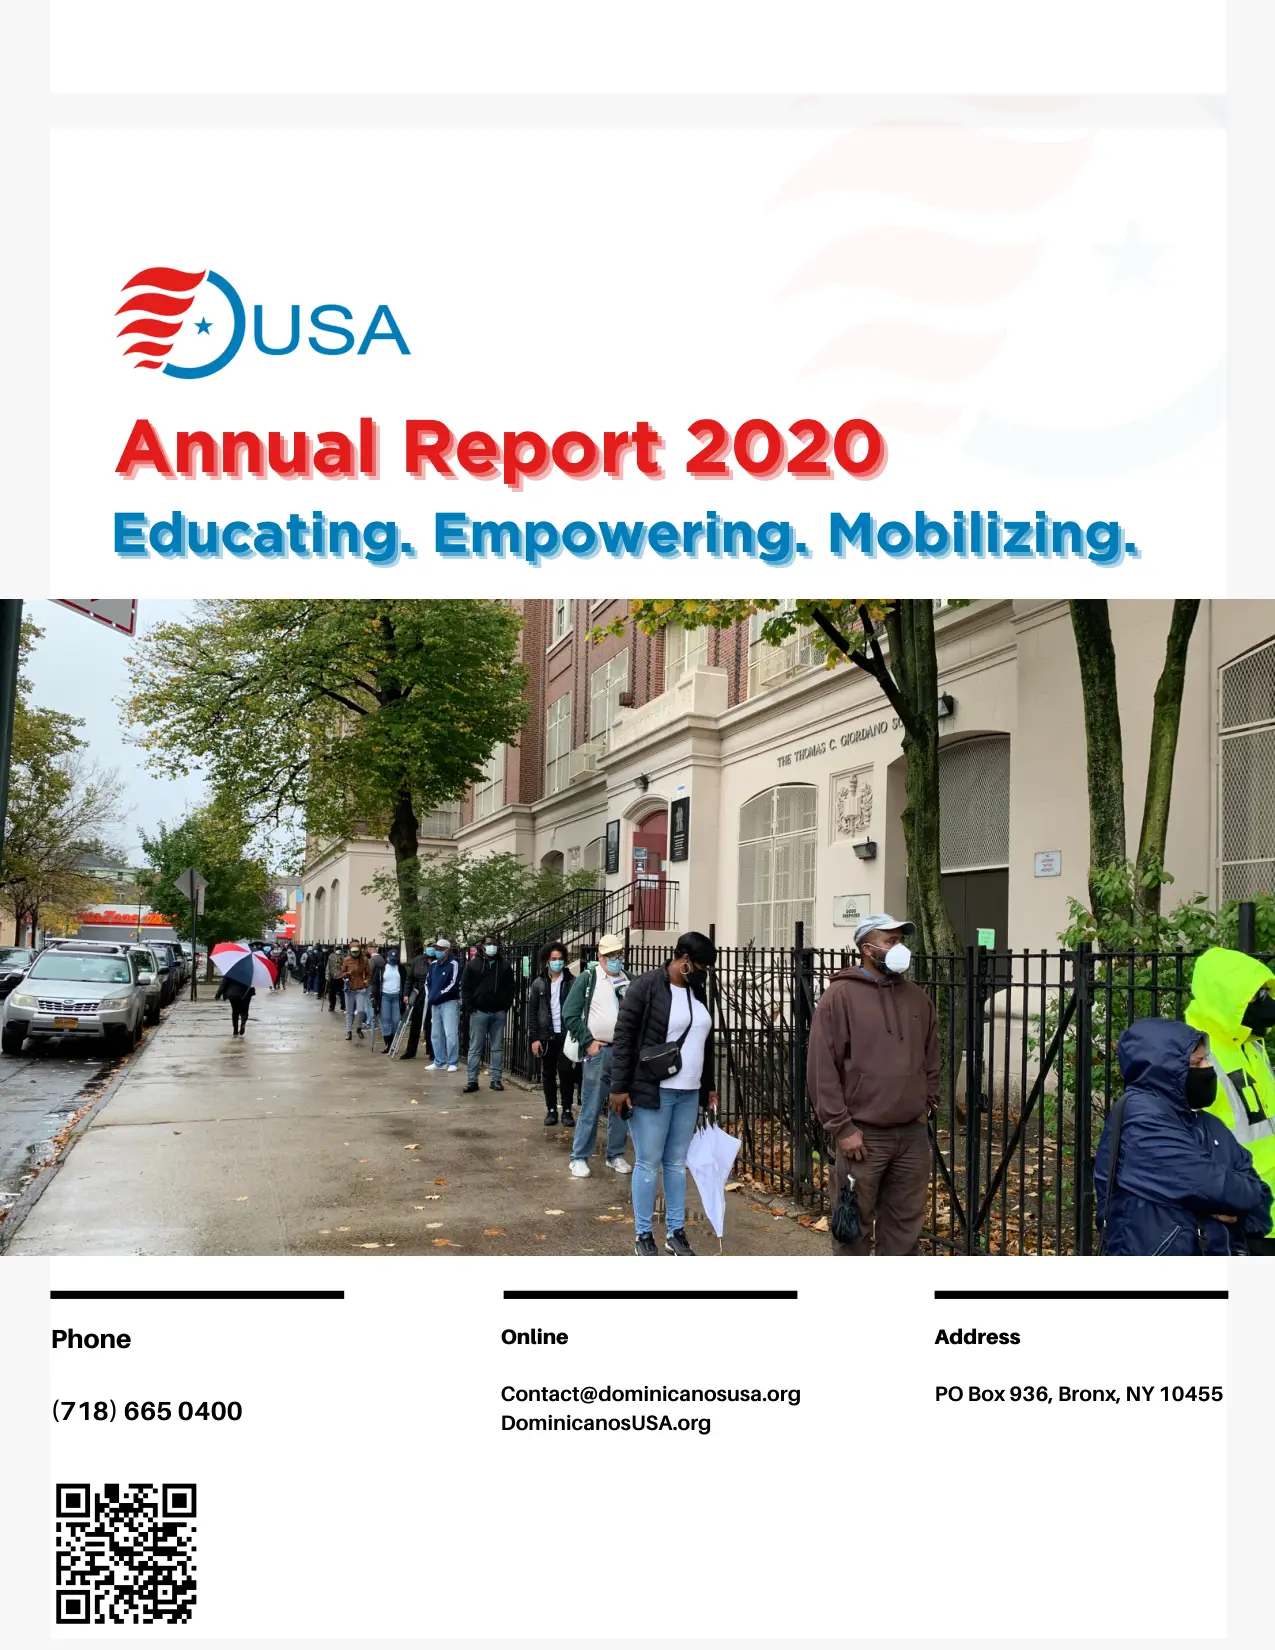
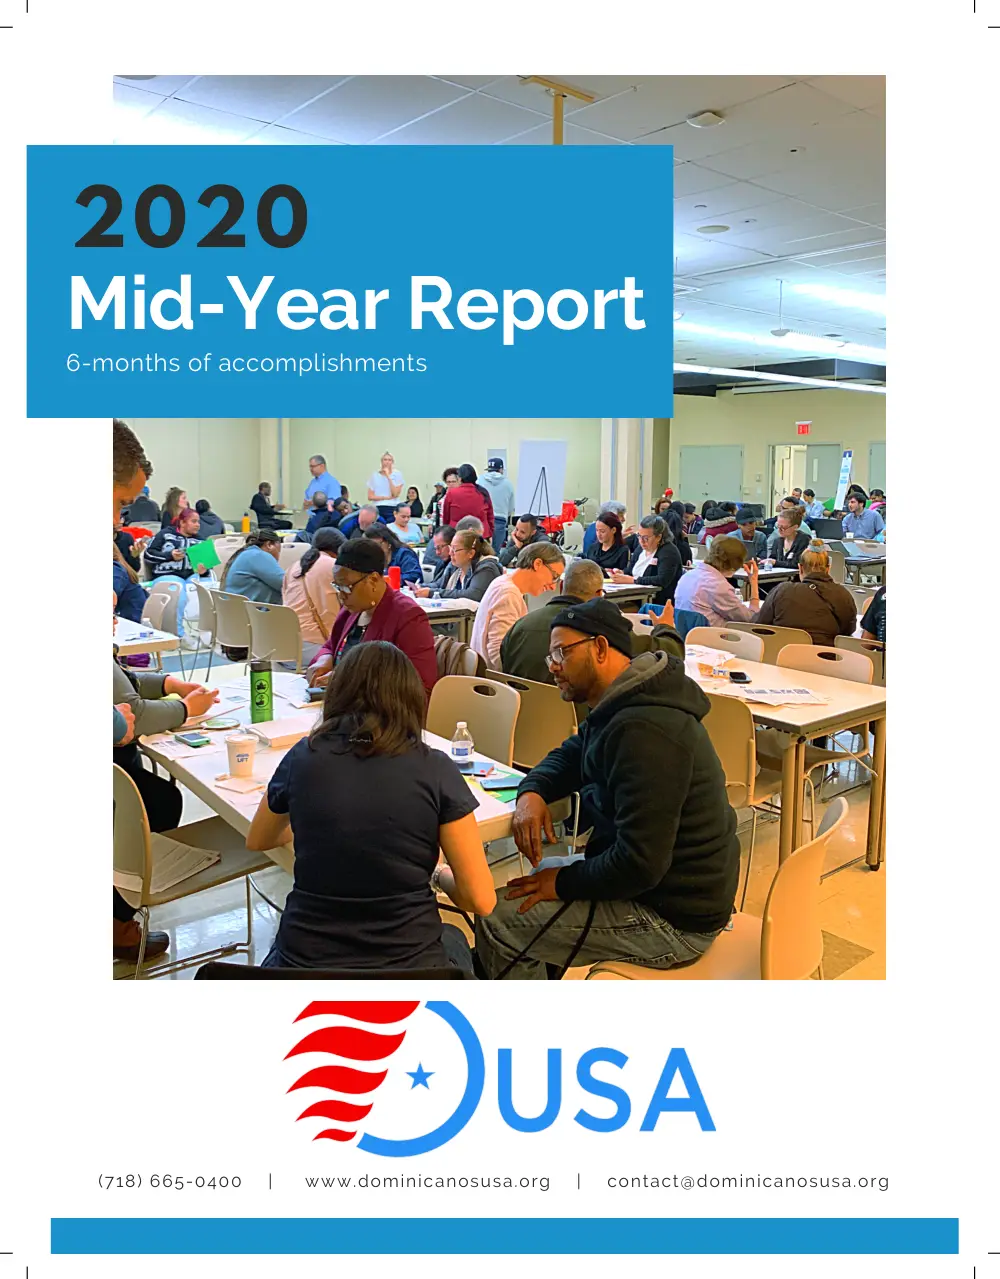
Every report, book-style
Flip any of them, then turn on the toolkit to see the design and where each figure was sourced.





Editorial lexicon